Twitter Trends Command Line
Creating a command line interface for Twitter trends
I wanted to come up with a way to quickly discover the trending twitter topics of different regions of the United States (and the world) without having to physically going to check each time. For that I decided to write a python program that would do this for me.
These are the following libraries I used for this project: tweepy argparse ascii_graph
I use argparse to handle the command line input flags, tweepy to interact with the Twitter Api, and ascii_graph to display the information back to me in the terminal. You will need a twitter dev account to have this work for you. It is pretty simple to get started with that due to twitter’s straight forward documentation so I will skip over that part.
The goal of this program was to use tweepy to interact with the twitter api and bring back current trending topics on twitter in a clear and concise manner to read. I would like the ability to chose which locations I get the current trends from and some control to determine how much information I get back.
Getting Started
We want to determine what kind of arguements we would want our function to have so these are the following arguements that I came up with for my program:
parser = argparse.ArgumentParser()
parser.add_argument("-w", "--woeid",
                    help="the woeid of where trends should come from")
parser.add_argument("-t", "--top", default=10, type=int,
                    help="the number of trends to get: default is 10")
parser.add_argument('-lol', '--listoflocations', nargs='*',
                    help='a list of locations')
parser.add_argument("-q", "--query",
                    help="gives tweets for a certain topic")
In the future I might come back to this program and explore other arguements and ideas for this program, but for now this is what the program has.
Getting logged into your tweepy api is fairly simple again thanks to the plentiful documentation of the Tweepy API:
    import secrets
    auth = tweepy.OAuthHandler(secrets.consumer_key, secrets.consumer_secret)
    auth.set_access_token(secrets.access_token, secrets.access_token_secret)
    twitter_api = tweepy.API(auth)
Tweepy has a function for getting all of the available trends so we can call that :
places = twitter_api.trends_available()
This is what a response from that call looks like :
{'name': 'Worldwide', 'placeType': {'code': 19, 'name': 'Supername'}, 'url': 'http://where.yahooapis.com/v1/place/1', 'parentid': 0, 'country': '', 'woeid': 1, 'countryCode': None}
Tweepy uses a Yahoo! where on earth ID (woeid) as codes for various locations. A total list of woeids can be found here. From the above response, we are interested in the following information from the response: name and woeid.
I store these two fields as a key value pair in a dictionary to make them easy to work with. I then wrap this into a function named get_woeid().
def get_woeid_usa():
    places = twitter_api.trends_available()
    all_woeids = {place['name'].lower(): place['woeid'] for place in places}
    return all_woeids
Next, knowing what trends corresponded to location was nice, but I also wanted to know the volume of the trending topic. This would help determine if some trends were much more viral than others. I would write a function that would take in a woeid as a parameter and return a key value pair of a trend and a trend volume. By creating this function, I realized I would probably need some way of handling the input if the user specified a location or a list of locations instead of a woied. I needed to write something that would take in the location name and spit back out the woeid for that loction. That ended up looking like the following:
def location_to_woeid(location):
    location = location.lower()
    trends = twitter_api.trends_available()
    error_string = "This location cannot be resolved to a WOEID"
    all_woeids = get_woeid_usa()
    if location in all_woeids:
        return all_woeids[location]
    else:
        raise ValueError('This location cannot be resolved to a WOEID')
I decided that if a location was entered that was not available in the list of available woeids that I would raise a ValueError and state that the location couldn’t be resolve to a WOEID. There is probably a better way to do this and it is definitely one of the things I will retouch on in the future. I will probably also explore the possibility of letting the user define a default location for themselves.
Returning to the function that generates a key value pair of the trend and trend volume, we can use the function written above to aid in that process. The finished function looks as so:
def trends_and_volumes(woeid):
    """
    create a dict of trends from a certain woeid, and tweet_volume
    :return: dict
    """
    if args.listoflocations:
        pass
    elif args.woeid:
        woeid = args.woeid
    # else:
    #     woeid = location_to_woeid(args.location)
    trending_topics = []
    tweet_volume = []
    woeid_trends = twitter_api.trends_place(woeid)
    for woeid_trend in woeid_trends:
        for x in range(args.top):
            trending_topics.append(woeid_trend['trends'][x]['name'])
            if woeid_trend['trends'][x]['tweet_volume'] is None:
                woeid_trend['trends'][x]['tweet_volume'] = 0
            tweet_volume.append(woeid_trend['trends'][x]['tweet_volume'])
    tempdict = dict(zip(trending_topics, tweet_volume))
    trend_volume_dict = OrderedDict(sorted(tempdict.items(),
                                    key=lambda t: t[1]))
    items = list(trend_volume_dict.items())
    items.reverse()
    trend_volume_dict = OrderedDict(items)
    return trend_volume_dict
When a twitter trend is too new and there is not enough tweet volume information available the twitter API gives it a value of None so I had to throw in a conditional statement to check for that and change those None values to 0 or else it would most likely give me issues when I planned on graphing the information later.
Now that we have the location, the trend, and the trend volume we can being trying to display the information. I had recently came across a github project called tweets_analyzer and really enjoyed how they had used ascii_graph to display their information so I figured I would take a stab at doing mine in a similar manner. I would display the information per location and specify the amount of trends requested by the optional --top arguement.
This is the final code that I settled on for displaying the trend and trend volume information:
def plot_trends_list(locationlist):
    if args.listoflocations:
        locationlist = list(args.listoflocations)
        for location in locationlist:
            trends_plus_volumes = trends_and_volumes(location_to_woeid(location))
            pattern = [Gre, Yel, Red, Cya]
            chart = trends_plus_volumes.items()
            data = vcolor(chart, pattern)
            graph = Pyasciigraph()
            time = datetime.datetime.now().time()
            for line in graph.graph("These are the current " +
                                    "trends for {} as of {}".format(
                    location.title(), time), data):
                print(line)
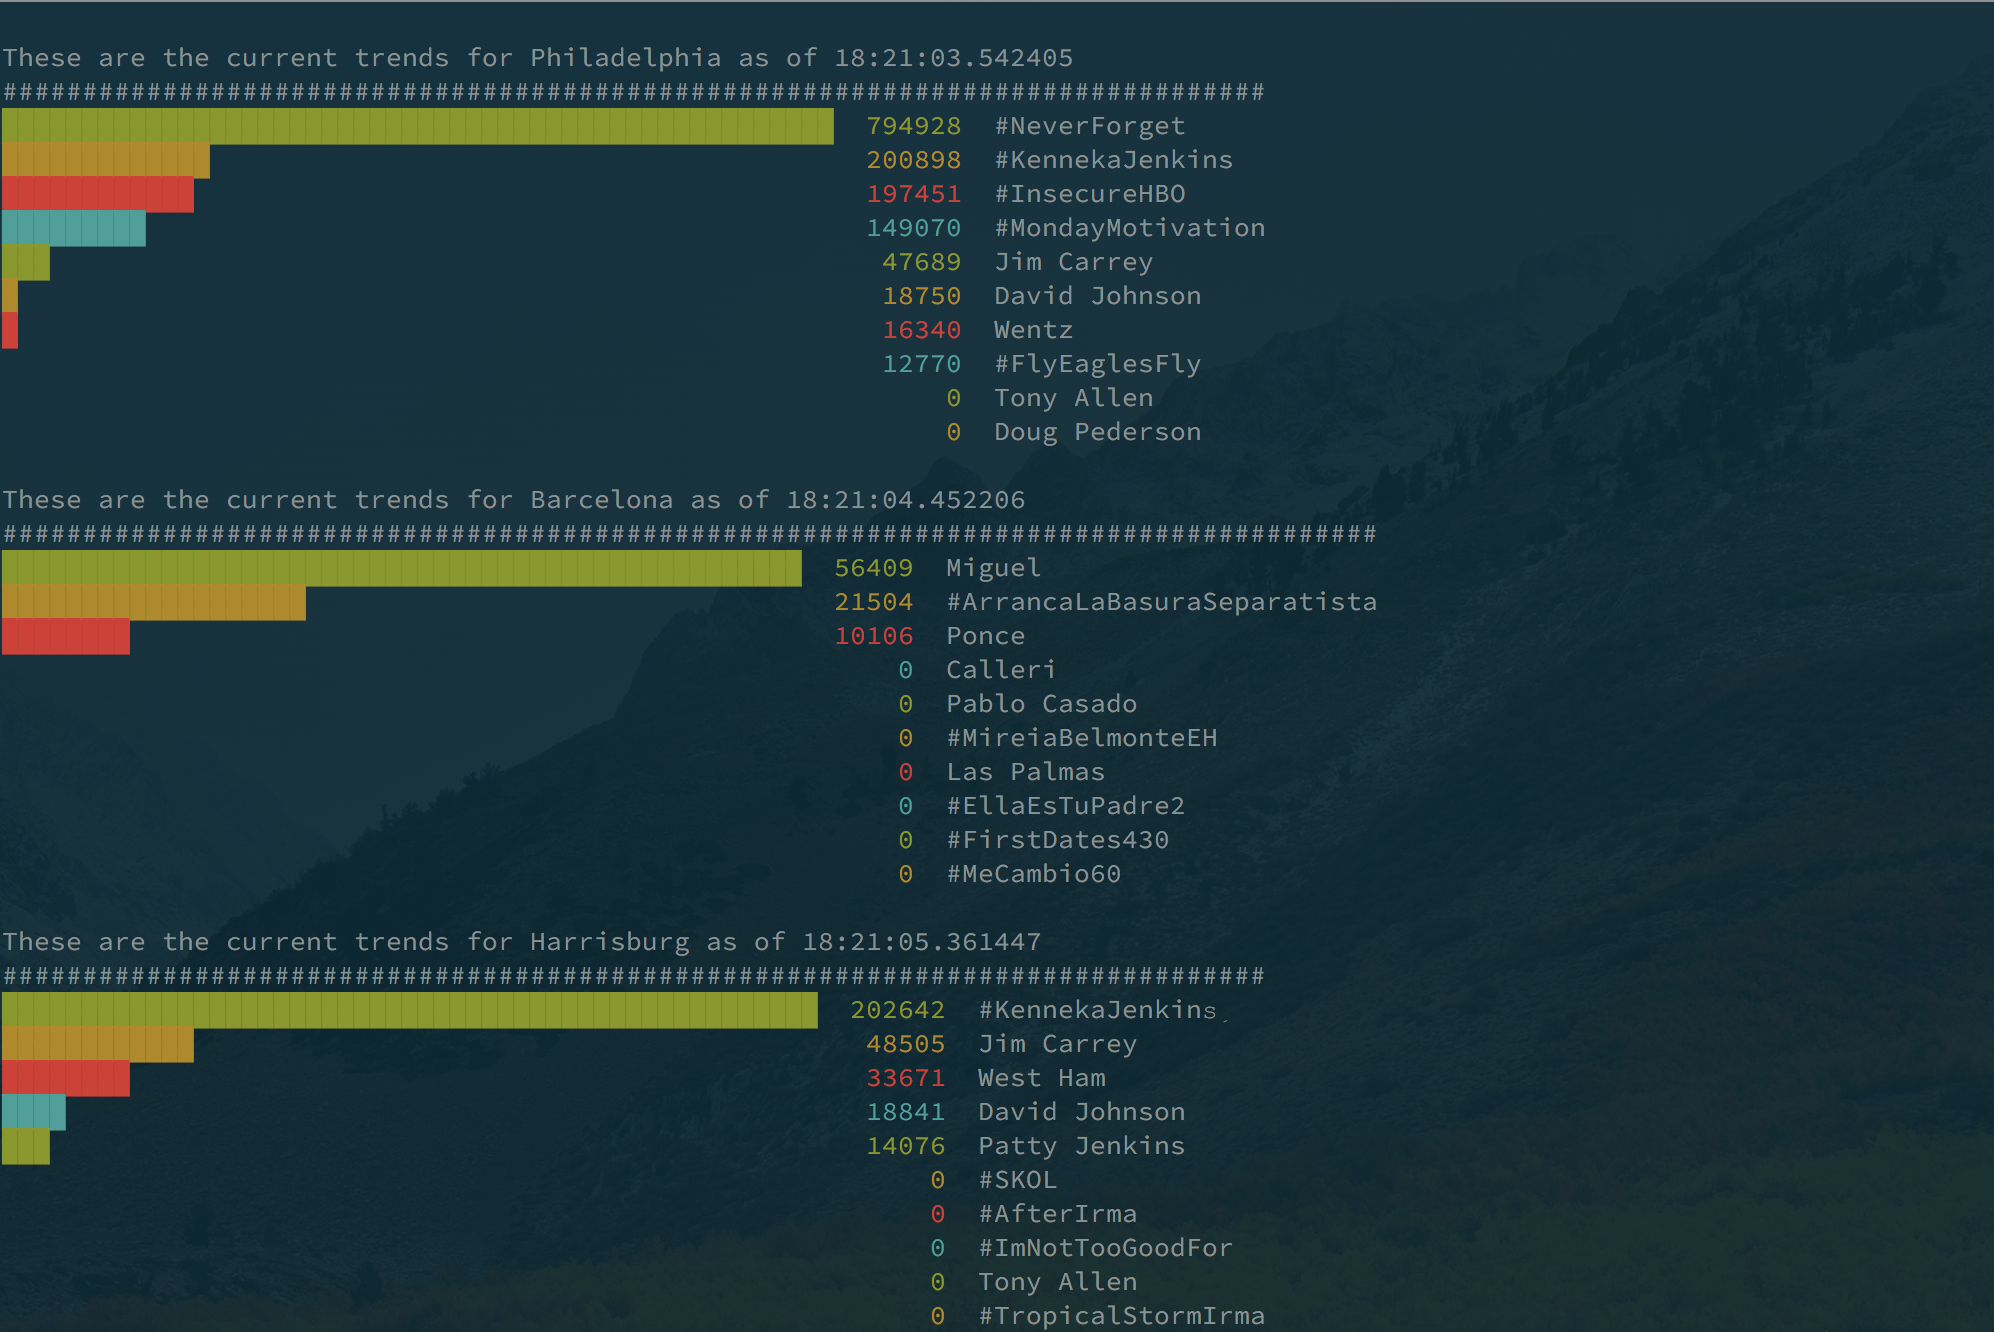
Here is what an example output of three different locations look outputted in the terminal:
python3 twitter_news.py -lol philadelphia barcelona harrisburg