Writing a script to easily access eBird sighting data
A Return
It has been quite awhile since I’ve added an entry to this website. There are a few factors behind my absence, however, the main cause was running into an issue with my old Macbook Pro (screen randomly stopped working) where I had most of my code stored. I did have my code pushed to GitHub but there were other projects/ideas/things I was working on that were not fully complete and therefore did not make it to GitHub. Apple wanted an exorbitant amount of money to fix the issue (more than half the original cost of the Macbook) so I opted for starting fresh with another Macbook Pro in hopes of some daying repairing my original. In addition to technology troubles there is always the issue of how to spend free time. Do I spend my freetime glued to a different set of screens in addition to the 8+ hours already spent earlier in the day? Or do I take time to step away and give myself a break? The latter won out for quite some time.
A quick project from while I was gone
Of course as mentioned in the title of this post, I (sometime ago) wrote a script to utilize the vast information present on the eBird website. For those that don’t know, eBird is an ` “online database of bird observations proividing scientists, researchers, and amateur naturalists with real-time data about bird distribution and abundance.”` Having recently found an affinity for photographing wildlife I planned to use this website to give me recent Owl sightings in my state. After all, there’s a much greater chance of finding an owl if you go to somewhere an owl sighting has already been reported.
Gaining access to the vast information that eBird has to offer can be simply done by registering for an API key and access. Once you are situated with your key and access you can now begin to access data. I chose to use eBird-API 3.0.6 from PyPi to handle accessing the data.
The steps to getting the data I wanted was fairly straight forward. I wanted to know what breeds of owls were native to my surrounding area and identify any sightings within the state I was located in. There are typically only 7 different species of owls that can be found near my area so I made note of those and began writing code.
First I created a list owl_codes of all the owls in my area by their alpha code. The alpha code is what is used to identify each species. I also created a list owl_locations which will display the data that I want returned to me.
# list of speciesCodes we want to get sightings for
owl_codes = ['grhowl', 'brdowl', 'easowl1', 'loeowl', 'sheowl', 'brnowl', 'nswowl']
# add the sighting to a list as (common Name, Location Name, Observation Date. link to checklist)
owl_locations = []
We can then go through each owl code in the owl_codes list and pass each code into a function that will return if there were any observations. From those observations we can pick which fields we want to display (mentioned above) and add that to the owl_locations list.
# loop through each owl code and get the sightings information
for oc in owl_codes:
    nearby = get_species_observations(ebird_keys.api_key, oc, 'US-DE')
    # extract the fields that we want
    for n in nearby:
        owl_locations.append((n['comName'], n['locName'], n['obsDt'], 'https://www.ebird.org/checklist/' + n['subId']))
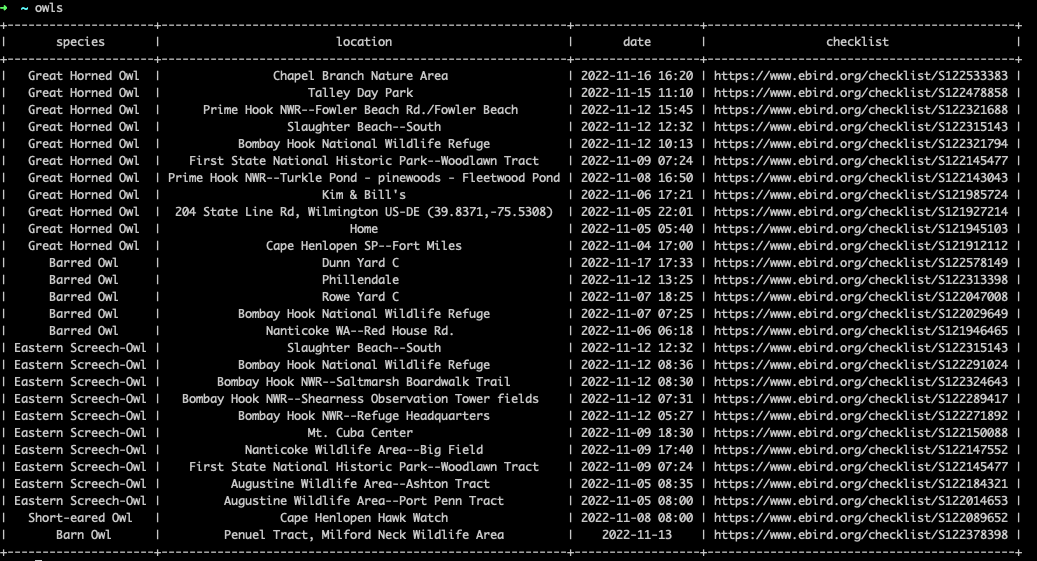
Finally, using PrettyTable we can display our findings in an aesthetically pleasing manner.
x = ColorTable(theme=Themes.DEFAULT)
x.field_names = ['species', 'location', 'date', 'checklist']

# display the information in an easy to read format
for ol in owl_locations:
    x.add_row([ol[0], ol[1], ol[2], ol[3]])
    # print("{} seen/heard at {} on {} {}".format(ol[0], ol[1], ol[2], ol[3]))
print(x)
Here is an example output of running my script :